Azure SQL Data Warehouse

data : https://rbdevdwhstorage.blob.core.windows.net/rbdevdwhtestdata/FlightData.csv

In my 3rd example, I explored SQL Data warehouse on AZURE.

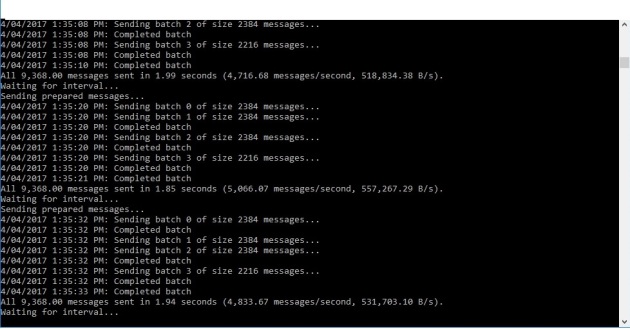
The idea was to take a half a million rows CSV and then process it using SQL Data Warehouse and see the performance.

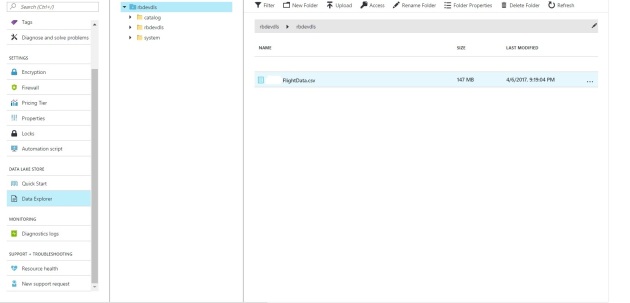
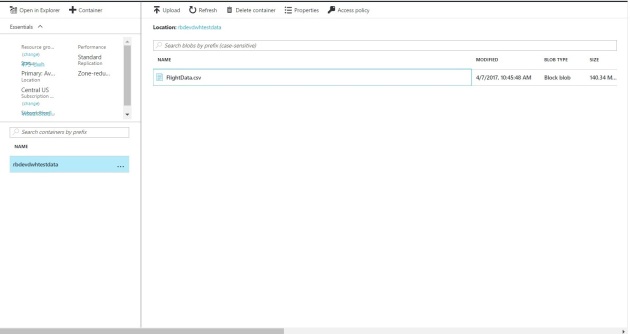
I provisioned one azure storage where i saved my test data and then one azure sql data warehouse of 100 dTUs. (least in data warehouses).

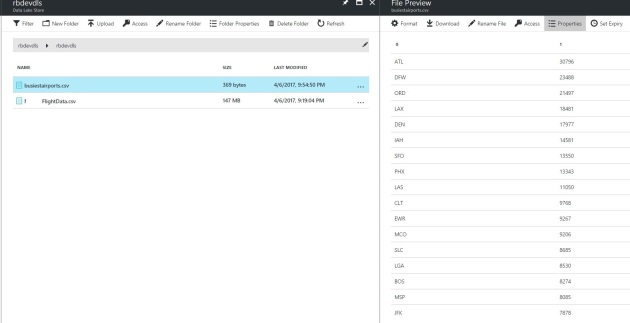
Snapshot of data stored to Azure Storage –

w1

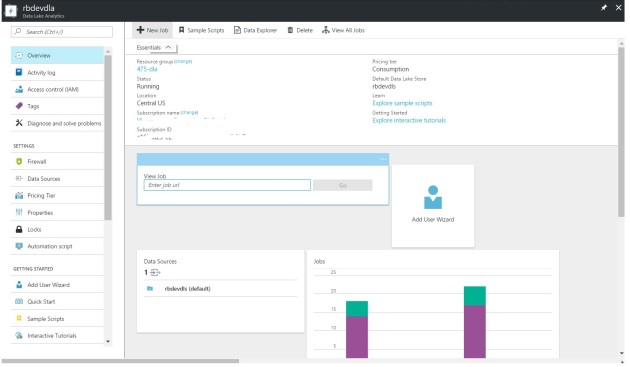
Azure SQL Data Warehouse. Copy the Server Name from here and open management studio.

w2.jpg

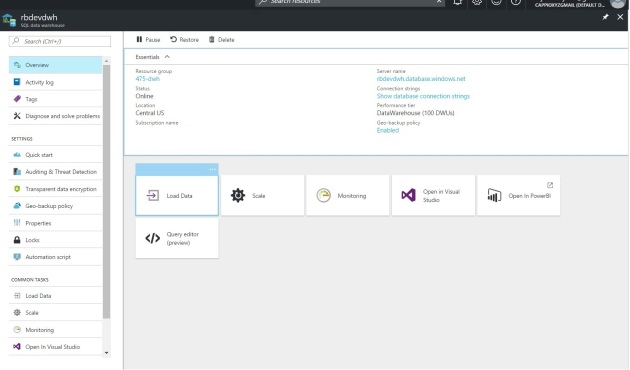
Using SQL Management studio, connect to this data warehouse like any MSSQL database.

w3.jpg


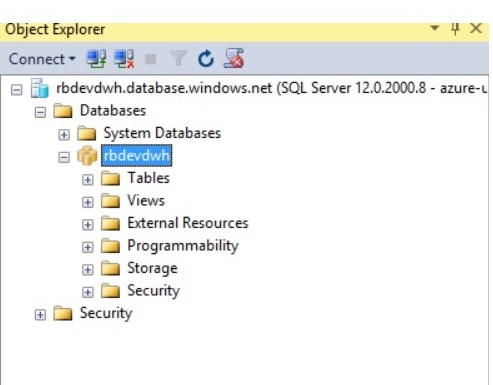
Once you are connected, open new query windows.

First step is to securely connect to the source data, here a csv with half a million rows.

CREATE MASTER KEY;

CREATE DATABASE SCOPED CREDENTIAL AzureStorageCreds
WITH IDENTITY = ‘[identityName]’
, Secret = ‘[azureStorageAccountKey]’
;

CREATE EXTERNAL DATA SOURCE azure_storage
WITH
(
TYPE = HADOOP
, LOCATION =’wasbs://[containername]@[accountname].blob.core.windows.net/[path]’
, CREDENTIAL = AzureStorageCreds
);

next define the format of the file we will be reading

CREATE EXTERNAL FILE FORMAT text_file_format
WITH
(
FORMAT_TYPE = DELIMITEDTEXT
, FORMAT_OPTIONS (
FIELD_TERMINATOR =’,’,
STRING_DELIMITER = ‘”‘,
USE_TYPE_DEFAULT = TRUE
)
);

next step is to make an external table, which is kind of a view to our source data

CREATE EXTERNAL TABLE FlightData
(
[Year] varchar(255),
[Quarter] varchar(255),
[Month] varchar(255),
[DayofMonth] varchar(255),
[DayOfWeek] varchar(255),
FlightDate varchar(255),
UniqueCarrier varchar(255),
AirlineID varchar(255),
Carrier varchar(255),
TailNum varchar(255),
FlightNum varchar(255),
OriginAirportID varchar(255),
OriginAirportSeqID varchar(255),
OriginCityMarketID varchar(255),
Origin varchar(255),
OriginCityName varchar(255),
OriginState varchar(255),
OriginStateFips varchar(255),
OriginStateName varchar(255),
OriginWac varchar(255),
DestAirportID varchar(255),
DestAirportSeqID varchar(255),
DestCityMarketID varchar(255),
Dest varchar(255),
DestCityName varchar(255),
DestState varchar(255),
DestStateFips varchar(255),
DestStateName varchar(255),
DestWac varchar(255),
CRSDepTime varchar(128),
DepTime varchar(128),
DepDelay varchar(128),
DepDelayMinutes varchar(128),
DepDel15 varchar(255),
DepartureDelayGroups varchar(255),
DepTimeBlk varchar(255),
TaxiOut varchar(255),
WheelsOff varchar(255),
WheelsOn varchar(255),
TaxiIn varchar(255),
CRSArrTime varchar(128),
ArrTime varchar(128),
ArrDelay varchar(255),
ArrDelayMinutes varchar(255),
ArrDel15 varchar(255),
ArrivalDelayGroups varchar(255),
ArrTimeBlk varchar(255),
Cancelled varchar(255),
CancellationCode varchar(255),
Diverted varchar(255),
CRSElapsedTime varchar(255),
ActualElapsedTime varchar(255),
AirTime varchar(255),
Flights varchar(255),
Distance varchar(255),
DistanceGroup varchar(255),
CarrierDelay varchar(255),
WeatherDelay varchar(255),
NASDelay varchar(255),
SecurityDelay varchar(255),
LateAircraftDelay varchar(255),
FirstDepTime varchar(255),
TotalAddGTime varchar(255),
LongestAddGTime varchar(255),
DivAirportLandings varchar(255),
DivReachedDest varchar(255),
DivActualElapsedTime varchar(255),
DivArrDelay varchar(255),
DivDistance varchar(255),
Div1Airport varchar(255),
Div1AirportID varchar(255),
Div1AirportSeqID varchar(255),
Div1WheelsOn varchar(255),
Div1TotalGTime varchar(255),
Div1LongestGTime varchar(255),
Div1WheelsOff varchar(255),
Div1TailNum varchar(255),
Div2Airport varchar(255),
Div2AirportID varchar(255),
Div2AirportSeqID varchar(255),
Div2WheelsOn varchar(255),
Div2TotalGTime varchar(255),
Div2LongestGTime varchar(255),
Div2WheelsOff varchar(255),
Div2TailNum varchar(255),
Div3Airport varchar(255),
Div3AirportID varchar(255),
Div3AirportSeqID varchar(255),
Div3WheelsOn varchar(255),
Div3TotalGTime varchar(255),
Div3LongestGTime varchar(255),
Div3WheelsOff varchar(255),
Div3TailNum varchar(255),
Div4Airport varchar(255),
Div4AirportID varchar(255),
Div4AirportSeqID varchar(255),
Div4WheelsOn varchar(255),
Div4TotalGTime varchar(255),
Div4LongestGTime varchar(255),
Div4WheelsOff varchar(255),
Div4TailNum varchar(255),
Div5Airport varchar(255),
Div5AirportID varchar(255),
Div5AirportSeqID varchar(255),
Div5WheelsOn varchar(255),
Div5TotalGTime varchar(255),
Div5LongestGTime varchar(255),
Div5WheelsOff varchar(255),
Div5TailNum varchar(255)
)
WITH
(
LOCATION = ‘/’,
DATA_SOURCE = azure_storage,
FILE_FORMAT = text_file_format,
REJECT_TYPE = value,
REJECT_VALUE = 100000
);

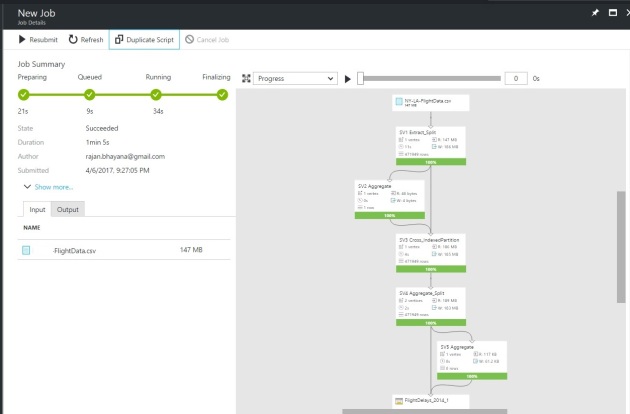
Once this done, we will run one final command to pull data to data warehouse

CREATE TABLE FlightDataStaging
WITH (DISTRIBUTION = ROUND_ROBIN)
AS
SELECT * FROM FlightData

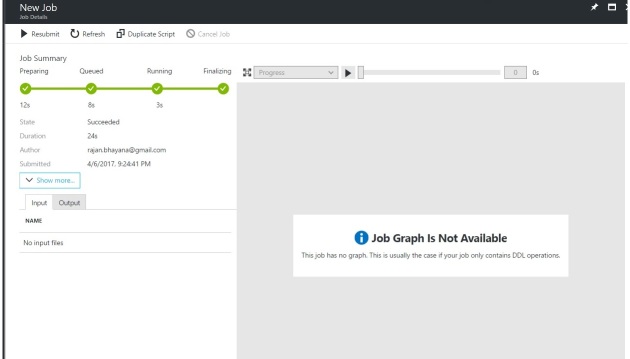
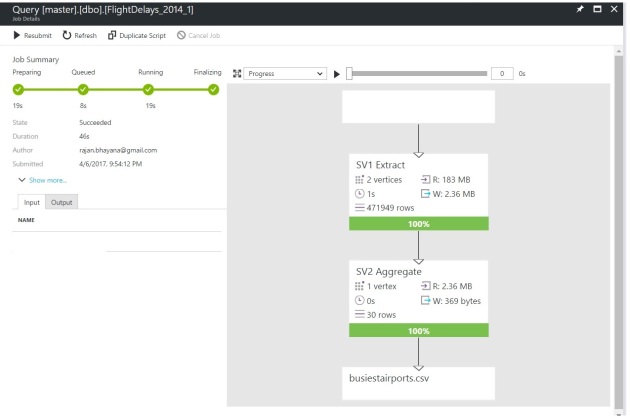
Once this is done, lets run a group by command on all the data and see how long it takes.

w4.jpg

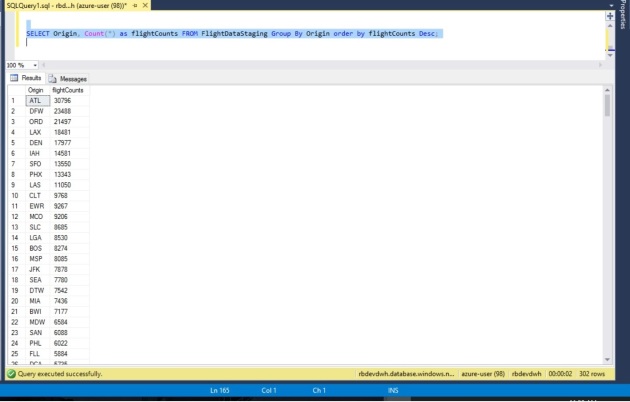
you will notice it barely took 2 seconds.

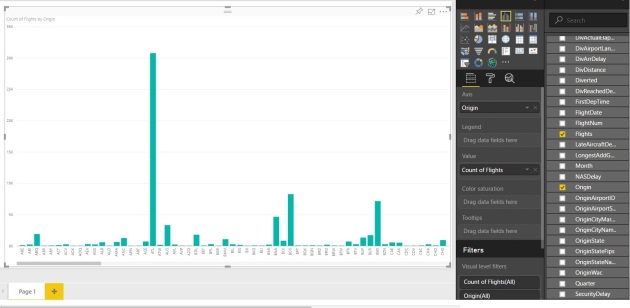
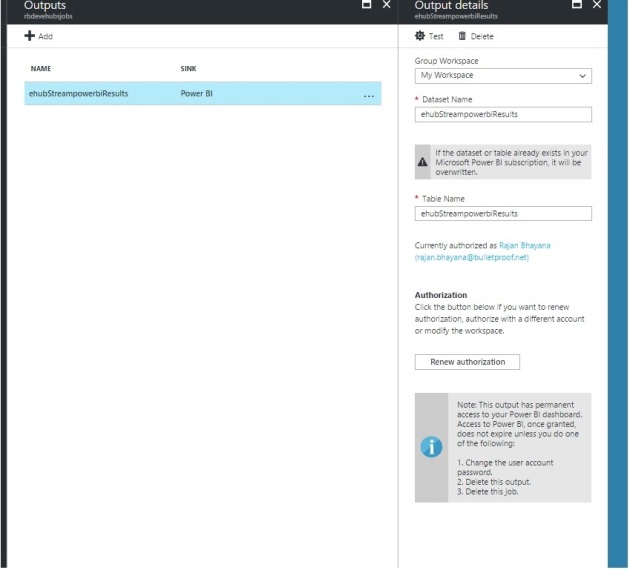
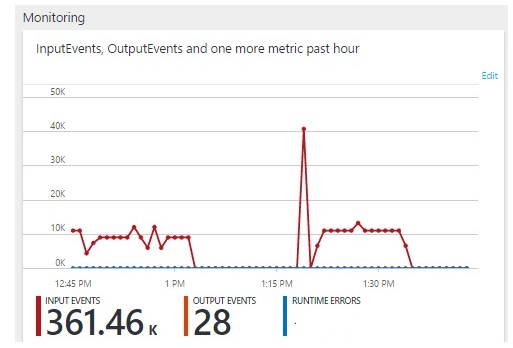
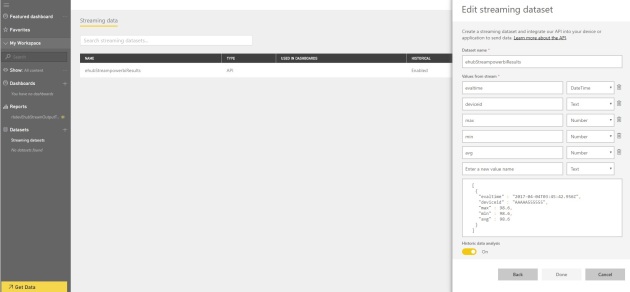
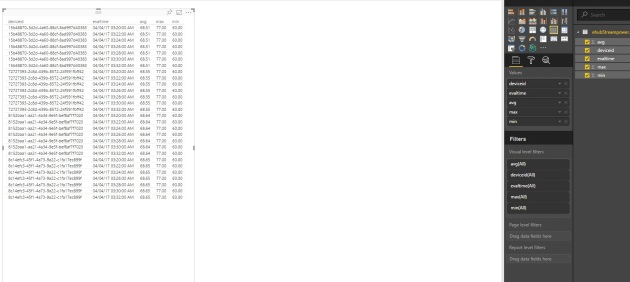
If we want, we can also link our data warehouse to powerBI , and display results.

I have tried to run similar report as above and it came up in no time.

w5.jpg

Azure Data Lake

data : https://rbdevdwhstorage.blob.core.windows.net/rbdevdwhtestdata/FlightData.csv


In my second example I wanted to use Azure Data Lake PAAS offering and see how it can help me batch process data quickly.

Inorder to check that, I downloaded a test excel file which had info of flight departures and delys from many USA major airports. Excel had close to half a million rows and i want to see how quickly data lake can parse this file for me and then run simple/complex queries.

The first step is to provision Azure Data Lake Storage to save the CSV and results. And to provision Azure Data Lake Analytics to run all the batch jobs and generate results.

Once the Data Lake Storage has been provisioned, click on the Data Explorer button and Upload the test CSV data.

b1

Once the upload is done, go to Azure Data Lake Analytics and Click on New Job.

b2.jpg

We will focus on 3 jobs here.

  • First Job will make a view that will read from the CSV file we have uploaded.
  • Second with then read all the data from the view and save it a new table on azure data lake storage that we can query.
  • we will run a test query that will go through half a milion rows and produce results in few seconds.

All we need to do it copy paste the jobs below one by one and submit them. If commands are ok, you should see screens similar to below

Step 1-

below is the command to create the view.

DROP VIEW IF EXISTS FlightDataView_2014_1;

CREATE VIEW FlightDataView_2014_1
AS
EXTRACT Year int,
Quarter int,
Month int,
DayofMonth int,
DayOfWeek int,
FlightDate string,
UniqueCarrier string,
AirlineID int,
Carrier string,
TailNum string,
FlightNum string,
OriginAirportID int,
OriginAirportSeqID int,
OriginCityMarketID int,
Origin string,
OriginCityName string,
OriginState string,
OriginStateFips string,
OriginStateName string,
OriginWac int,
DestAirportID int,
DestAirportSeqID int,
DestCityMarketID int,
Dest string,
DestCityName string,
DestState string,
DestStateFips string,
DestStateName string,
DestWac int,
CRSDepTime string,
DepTime string,
DepDelay double?,
DepDelayMinutes double?,
DepDel15 double?,
DepartureDelayGroups string,
DepTimeBlk string,
TaxiOut double?,
WheelsOff string,
WheelsOn string,
TaxiIn double?,
CRSArrTime string,
ArrTime string,
ArrDelay double?,
ArrDelayMinutes double?,
ArrDel15 double?,
ArrivalDelayGroups string,
ArrTimeBlk string,
Cancelled double?,
CancellationCode string,
Diverted double?,
CRSElapsedTime double?,
ActualElapsedTime double?,
AirTime double?,
Flights double?,
Distance double?,
DistanceGroup double?,
CarrierDelay double?,
WeatherDelay double?,
NASDelay double?,
SecurityDelay double?,
LateAircraftDelay double?,
FirstDepTime string,
TotalAddGTime string,
LongestAddGTime string,
DivAirportLandings string,
DivReachedDest string,
DivActualElapsedTime string,
DivArrDelay string,
DivDistance string,
Div1Airport string,
Div1AirportID string,
Div1AirportSeqID string,
Div1WheelsOn string,
Div1TotalGTime string,
Div1LongestGTime string,
Div1WheelsOff string,
Div1TailNum string,
Div2Airport string,
Div2AirportID string,
Div2AirportSeqID string,
Div2WheelsOn string,
Div2TotalGTime string,
Div2LongestGTime string,
Div2WheelsOff string,
Div2TailNum string,
Div3Airport string,
Div3AirportID string,
Div3AirportSeqID string,
Div3WheelsOn string,
Div3TotalGTime string,
Div3LongestGTime string,
Div3WheelsOff string,
Div3TailNum string,
Div4Airport string,
Div4AirportID string,
Div4AirportSeqID string,
Div4WheelsOn string,
Div4TotalGTime string,
Div4LongestGTime string,
Div4WheelsOff string,
Div4TailNum string,
Div5Airport string,
Div5AirportID string,
Div5AirportSeqID string,
Div5WheelsOn string,
Div5TotalGTime string,
Div5LongestGTime string,
Div5WheelsOff string,
Div5TailNum string
FROM “/rbdevdls/FlightData.csv”
USING Extractors.Text(‘,’, null, null, null,
System.Text.Encoding.UTF8, true, false, 1);

Upon execution, you should see similar screen

b3

Once the view is created to the CSV file, we will dump this data to a Data Lake catalog table using command belows

DROP TABLE IF EXISTS FlightData_2014_1;

CREATE TABLE FlightData_2014_1(
INDEX idx_year CLUSTERED (Year)
DISTRIBUTED BY RANGE (Year)
) AS
SELECT *
FROM FlightDataView_2014_1;

you will note that Azure Data Lake will quickly dump half a million rows data to the table from excel.

b4.jpg

If you want to see where this data is, Click on Data Explorer in Data Lake, and then click on catalog. Under Catalog, expand Master->Tables and you should see it there.

Now last part to see the performance of azure Data lake. I write the query below to read all the half a millions rows and produce airport list, ordered by number of flights. We will save the result of this job to a CSV file ->busiestairports.csv

@results =
SELECT Origin, COUNT(*) AS Counted
FROM FlightData_2014_1
GROUP BY Origin
ORDER BY Counted DESC
FETCH 30 ROWS;

OUTPUT @results
TO “/rbdevdls/busiestairports.csv”
USING Outputters.Csv();

you will note that azure data lake will wrap that up in 46 secs and create the file for you too.

b5.jpg

Now we can go back to azure data lake storage and view the results

b6

Azure real time analytics

I have been thinking of exploring Azure PAAS offering in Data warehousing/analytics for a while and finally decided to go ahead with 2-3 examples that will help me cover most of the PAAS offering.

In the first example, I am using Event hubs and see if i can try some real time analytics there using azure stream analytics jobs. I assumed that I am sitting in a big mall where thermometers keep sending temperature readings frequently to Azure Event Hubs. Then i am using this data to check temperature every 2 minutes and see if there is no drop/rise in data that indicate some issue with cooling system/heaters.

I started off by provisioning a event hub with 4 partitions in Azure.s1

Then I made a code in c# which sends seed data to this Azure Event Hub in the same pattern a real thermometer/thermostat would do.s2.jpg

Data was send in JSON format. Here is the example of data send.

s3

Once I am sure data is being received by Events Hubs, I want to do some real time stream analytics and make sure that i get updates for every few minutes for each device.

For Stream Analytics in this example, I Went ahead with azure PAAS offering, Stream Analytics Jobs.

s4

Every Stream Analytics has 3 important setups. Input, thats where our real time data will be picked from (here an Event Hub). Output, where the results of analysis will be saved, (here Power BI) and a query/function which manipulates input data.

See below on how we have setup these 3 in stream analysis.

On the Event Hub Dashboard in portal click input and add these details to attach it to an event hub for input.

s5.jpg

Click on test to make sure input endpoint is valid. Then go back to Event Hub Portal and click Output. And then add Power BI as output.

s6

In this case we will setup a query to check Min, Max and Average Temperature every 2 minutes and publish results on power bi so that end user can check if temperature stats are ok.

See below for query –

s7

Save the Query and Then go back to Event Hub Portal. Start the Stream Analytics Service and Check The graph to make sure Input is processed and Output is generated.

s8.jpg

Once Output is generated, go to Power BI and see if dataset is created for this exercise and if its getting refreshed.

You should see a new Dataset created.

s9.jpg

We can now use this dataset to created any report. I have made a simple table to show data produced every 2 minutes.

s11.jpg